
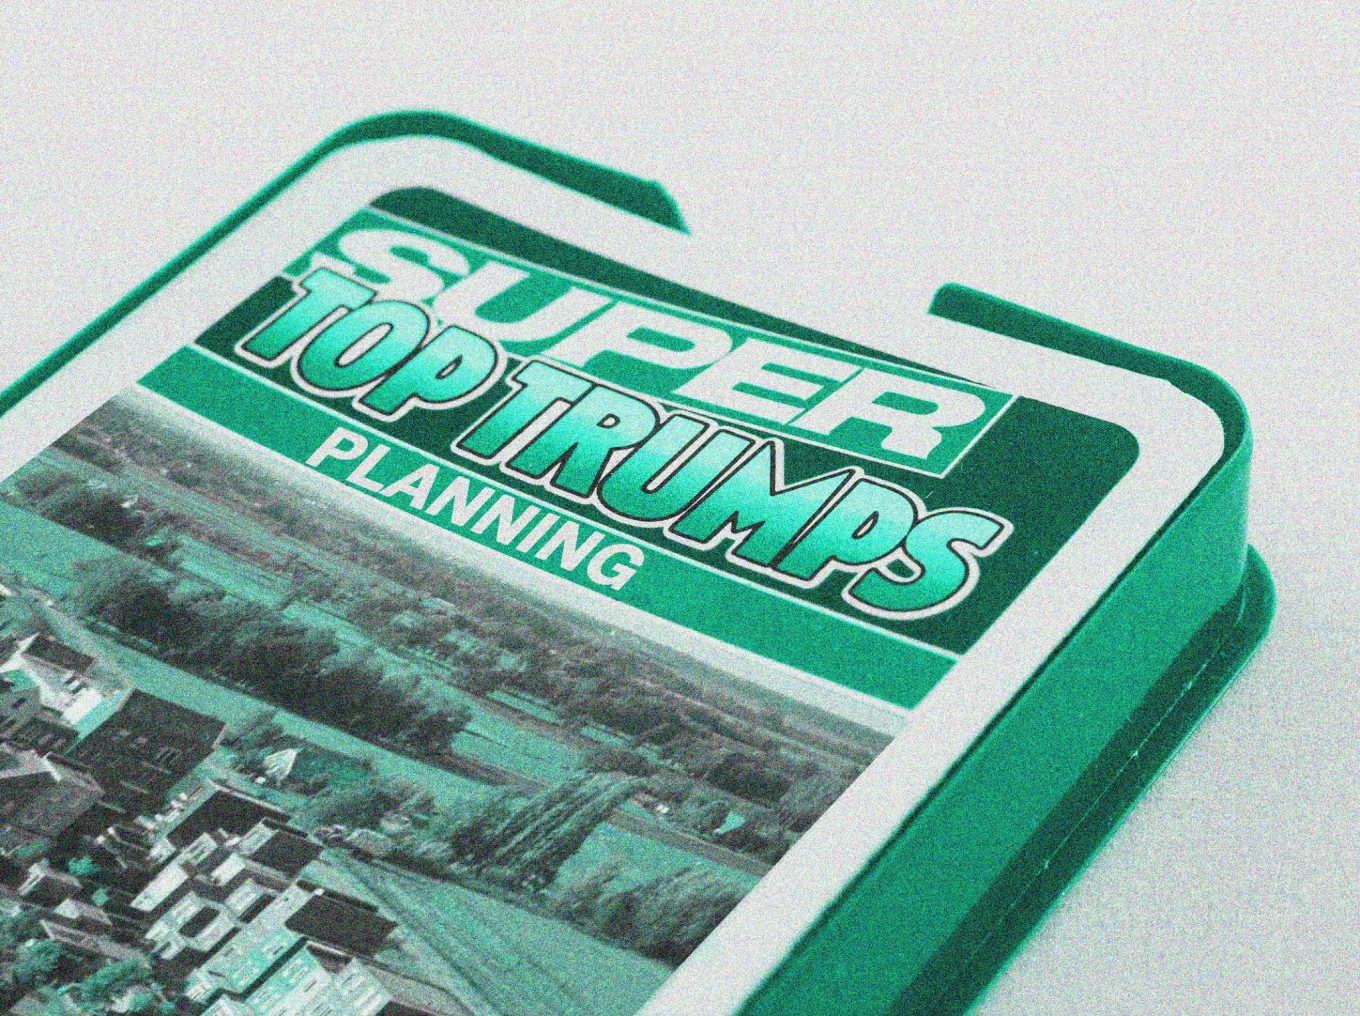
“In the Netherlands, planning is seen as part of the solution, in the UK, planning is seen as part of the problem” The quote from Clive Bett MP prompted Vicky Payne to play a little game of Top Trumps.

 The statement came when Clive Betts was interviewed on a recent edition of the 50 Shades of Planning Podcast. Clive is Chair of the Housing, Communities and Local Government Committee – a cross party scrutiny group that recently published an intelligent and even-handed analysis of the Planning White Paper.
This comparison with the Netherlands comes up often, especially in the urban design circles that I move in. The Netherlands exists in our minds as a planning utopia; a common destination for best practice field trips, much cited in case studies and frequently admired in industry press coverage. In practical terms though, how is it actually different? What does being seen as ‘part of the solution’ actually look like in practice? I think it’s time to play Top Trumps.
Resourcing
An easy comparison. The 2019 RTPI Report ‘Resourcing Public Planning‘ highlighted that there are around 22,000 planners in the UK, or around one planner for every 3,000 persons. The Netherlands has one planner per 1,100 persons. My maths is NOT GOOD, but I make that 2.7 times as many planners. The Netherlands wins, hand over the damn card.
Respect
In the same report, research found that people ‘think of young practitioners in the Netherlands as being among the lucky few who are able to make a difference to society by using their special skills set and creativity to contribute to the process of societal consensus’. Gordon Cullen, the British urban designer charmingly joked in the introduction to A Concise Townscape about a ‘happy day’ when people in the street throw their caps in the air at the sight of a planner, as they now do for footballers and pop singers. Perhaps the situation can be tested with the much teased 50 Shades of Planning merch, but reader, I don’t think we’re quite there yet.
Organisations like Public Practice are pushing hard to challenge both the perception and reality of public planning, but all the time our own Prime Minister is tossing around phrases like ‘sclerotic’ I think it’s fair to say they don’t get much in the way of kudos.
Now I’m aware we have quickly got away from the hard numerical values required for a game of Top Trumps and into the wild west of comparing qualitative individual perspectives. I resolve to do better, but the Netherlands probably wins again.
Ratios
Another RTPI report looked at the composition of the built environment profession in different countries, splitting broadly between architects, surveyors and planners. The proportion of planners in the Netherlands is 45%, while in the UK it is 16%. Now this could be down to differences in the way that the term “planner” is defined, but what is significant is that the UK is unique in that surveying is the largest of the three professions, more than double the EU average.
This supports the point made in URBED’s 2014 Wolfson Prize winning essay on Garden Cities, that key to the UK’s dysfunctional system is the price of land: ‘This is where the money is to be made in the housing market. The main beneficiaries are not just the lucky farmers but the whole industry of land agents, planning consultant, lawyers and barristers who exist to unlock this value’.
With its ‘plans over land’, ‘regulation over speculation’ approach, the Netherlands wins. Fans of fairness will notice that I’m judge, jury and executioner in this theoretical game, and that my opinion holds far more weight than the non-existent numbers on the non-existent cards – well, it is my article.
This brings us onto the big one – we have all seen the graph that shows public sector housing delivery wither away over time. We know that local authorities have very limited opportunities to deliver development and the required infrastructure that supports it.
Rights (for want of another heading starting with an R)
There are various funding programmes that support local government projects, and UK authorities do have Compulsory Purchase Orders as a tool for land assembly, though they are rarely used.
The Netherlands take it to a totally different level. Municipal authorities play an active role in assembling huge areas of land for development, with tools that allow them to purchase land quickly at existing use values. They also have their own bank from which they can fund the infrastructure and services required by such development. They can then subdivide the serviced land into plots, sell them to house builders and reinvest the profits.
If you want to see just how momentus the scale of these interventions can be, check out the VINEX housing programme; a total of 750,000 houses were built over the period 1996 to 2005, of which 60% can be classified as VINEX. VINEX sought to create places that were relatively compact (over 30 dwellings per hectare) to preserve the countryside, well-connected by public transport to keep car travel to a minimum, with at least 30 per cent affordable housing.
For having planners and local authorities being the driving force behind high quality development, rather than vilified for its obstruction, the Netherlands must win again.
In embarking on this adventure I realised quickly that the game could go on and on, with very predictable outcomes. Alas, I’ve reached the limit of my own patience and potential headings starting with ‘R’ so we’ll have to call it a day for now. It’s worth noting that when I was looking into this I came across sources suggesting that the Netherlands may be interested in adopting more of an English approach to planning and that their housing provisions is being dragged towards privatisation and financialisation, so it may be in the future that the game of Planning Top Trumps will be a more closely fought affair!